
A Net Promoter Score (NPS) measures customer loyalty by asking how likely someone is to recommend your company on a scale of 0 to 10. Scores are calculated by subtracting detractors from promoters, resulting in a range from -100 to 100. While many organizations consider 20 to 30 a "good" NPS score, high-performing IT support teams often achieve 50 or higher by improving resolution speed, knowledge management, reducing customer effort, and ensuring consistent service quality. A strong NPS reflects operational excellence, not just customer satisfaction.
Most IT teams think a good NPS score sits somewhere between 20 and 30. That range is the accepted industry average for many technical support environments. Service desk managers often look at a score of 25 and feel confident that their teams are performing well.
But average does not mean effective. An average score often hides massive operational inefficiencies. It masks poor routing, slow ticket resolution, and high customer effort. Customers might eventually get their problems solved, but the journey to get there is full of friction.
This blog explains what an NPS score actually measures and what a 50+ score looks like in real operations. We will explore the specific systemic changes your service desk must make to break out of the average zone and achieve true operational excellence.
NPS Score Meaning, Scale, and Why "Good" Is Misunderstood
What is an NPS score and what does it mean?
A Net Promoter Score (NPS) measures customer loyalty by asking how likely someone is to recommend your company on a scale from 0 to 10. The score reflects the overall experience of the customer over time, not just satisfaction with a single ticket. Because it measures long-term loyalty, it serves as a key indicator of organizational growth.
How to calculate NPS score?
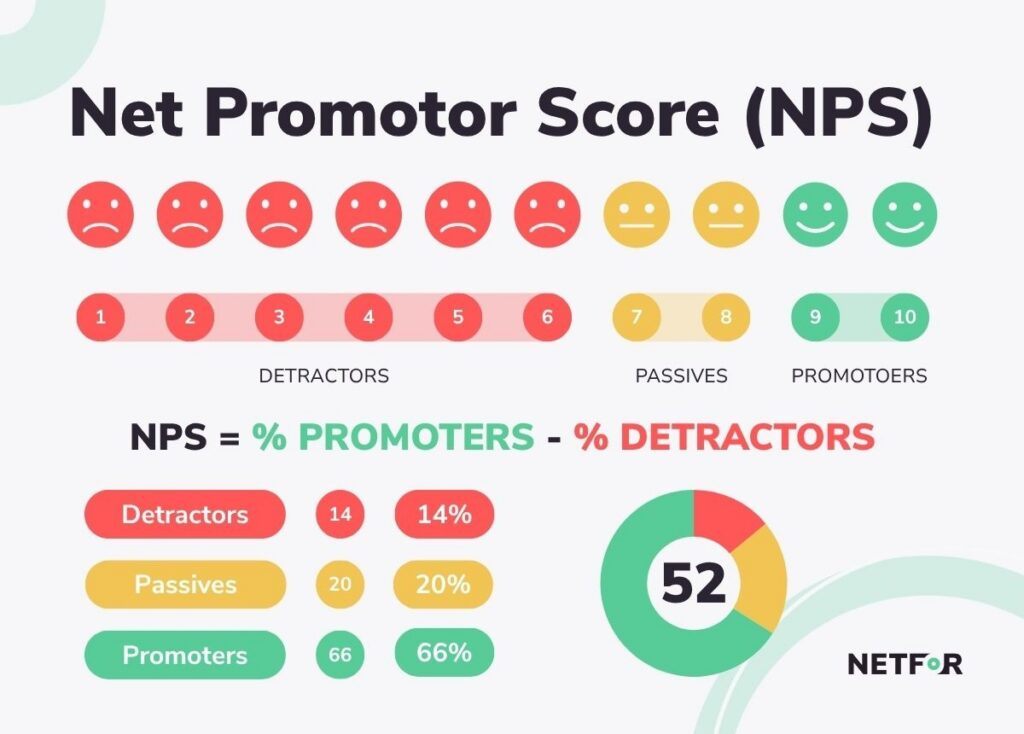
NPS is calculated by subtracting the percentage of detractors from the percentage of promoters. The mathematical formula looks like this: NPS = % Promoters minus % Detractors.
- Promoters (9 to 10): These are loyal enthusiasts who will continue to buy and refer others to your service.
- Passives (7 to 8): These customers are satisfied but unenthusiastic. They do not help your score at all, and they are highly vulnerable to competitive offerings.
- Detractors (0 to 6): These are unhappy customers who can damage your brand through negative word of mouth.
Passives are completely ignored in the final calculation. This makes the scoring system extremely rigorous. Even a rating of 6 counts as a detractor.
What is the NPS score scale and ranges?
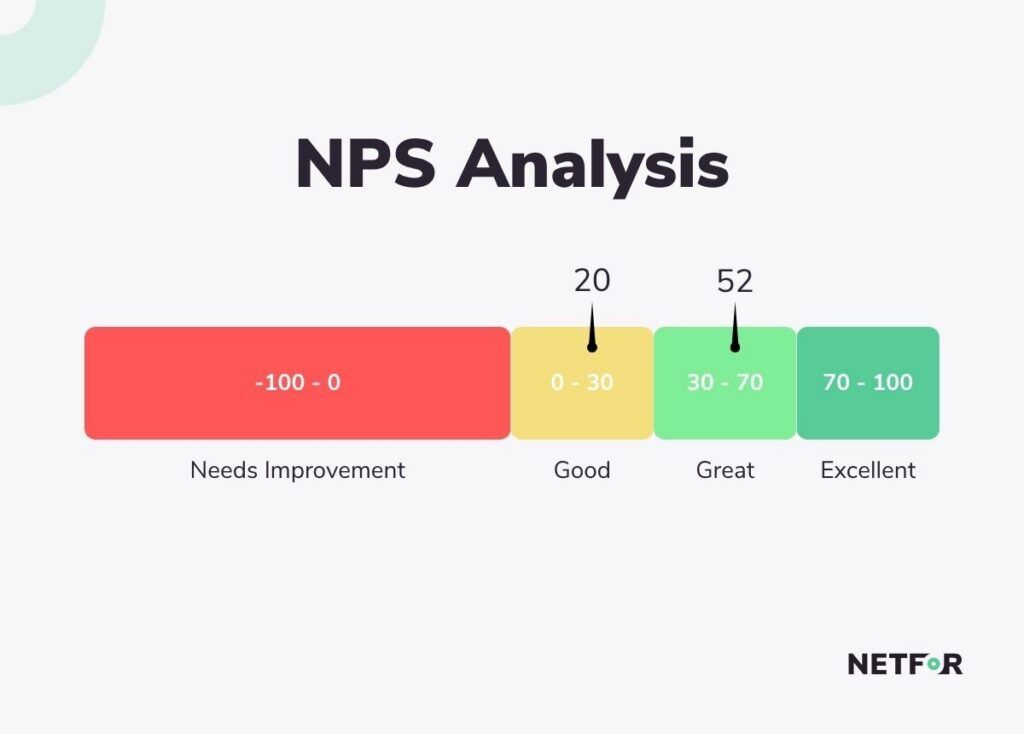
The NPS score scale ranges from -100 to 100. Understanding these ranges helps organizations evaluate their true standing:
- -100 to 0: Poor performance, more detractors than promoters
- 0 to 30: Average or Industry baseline
- 30 to 50: Strong performance
- 50+: Excellent and High-performing
- 70+: World-class
Many IT leaders misunderstand what a score of 20 actually means. A score of 20 means you have a very narrow margin of advocacy. A score of 50 indicates a strong promoter base and high operational maturity. NPS is not a simple survey metric. It is a reflection of your operational performance.
What a 50+ NPS Score Actually Looks Like in IT Support
What is a good NPS score in IT support?
A good NPS score depends heavily on the industry. In IT support and customer service, most organizations fall between 20 and 30. A score of 50 or higher is considered excellent. It indicates strong operational performance, fast resolution times, and incredibly low customer effort.
Industry CX benchmarks reveal that technology and B2B SaaS companies average between 30 and 45 (Qualtrics, 2026). However, top-tier organizations shatter these averages.
High-performing entities look fundamentally different from average support desks:
- Apple: Maintains a score between 60 and 72 through seamless support integration.
- Nutanix: Reached an incredible 92 in the B2B SaaS space by focusing on rapid issue resolution.
- Costco: Scores between 70 and 80 by ensuring extreme loyalty and effortless retail experiences.
Most teams plateau at around 20 because they view service as a series of isolated interactions. They believe that if agents smile and use polite language, the score will go up. However, the gap between a 20 and a 50 is not incremental. It is structural. High scores come from reducing friction in the support pipeline.
Something to consider: Any NPS score reflects how your system works, not how your agents behave.
The Real Drivers of NPS in IT Support
What is the difference between NPS and CSAT?
CSAT (Customer Satisfaction) measures how satisfied a customer is with one specific interaction. NPS measures long-term loyalty and the likelihood to recommend the brand. A customer can be completely satisfied that a technician eventually fixed their laptop (high CSAT). But if it took three phone calls and two transfers to get that fix, that same customer will not recommend your service (low NPS).
The real drivers of high NPS scores live deep within your operational data.
The first driver is First Call Resolution (FCR). FCR measures the percentage of issues resolved during the very first interaction. Industry benchmarks show that an average FCR is around 70 percent. World-class support desks like Netfor achieve 90 percent or higher. Research shows a direct correlation here. A 1% increase in FCR equals a 1% increase in CSAT, which directly lowers operating costs and boosts NPS (Zendesk, 2026).
The second driver is the Customer Effort Score (CES). Gartner research reveals that 96% of customers who experience a high-effort service interaction become disloyal (Qualtrics, 2026).
To move the needle, IT operations must focus on:
- Escalation rates: Lowering the number of tickets passed to Level 2 or Level 3 support.
- Resolution speed: Measuring the true time from ticket creation to complete closure.
- Transfer loops: Eliminating scenarios where customers are bounced between departments.
- Intake: Ensuring complete, accurate information is captured at the first point of contact so tickets are correctly categorized, prioritized, and routed without delays or rework.
NPS improves when you remove friction. You need fewer transfers, faster resolution, and less repetition.
Why Most IT Support Teams Stay Stuck at ~20 NPS
Why is my NPS score low even if customers seem satisfied?
Many organizations struggle with high CSAT but surprisingly low NPS. This happens because customers experience hidden friction. Common causes include long wait times, repeating information to new agents, and slow overall resolution. NPS reflects the entire technical journey, not just the final outcome.
Most IT support teams stay stuck at the industry average because of fragmented systems and broken processes.
A major culprit is poor intake and ticket quality. When a help desk agent captures the wrong information on the first call, the ticket gets misrouted. This leads to escalation inefficiencies. The customer waits days for a response, only to find out the ticket went to the wrong department.
For organizations managing physical hardware, the lack of a "Shift Left" strategy creates massive liability. A Shift Left strategy means resolving issues remotely before sending a technician on-site. Data shows that 14% to 20% of field service dispatches are completely unnecessary (Aquant, 2026).
The financial cost of these inefficiencies is staggering:
- High downtime costs: Unplanned IT outages cost an average of $5,600 per minute (Netfor, 2026).
- Unnecessary truck rolls: Sending a technician out can cost around $250 per visit in labor and travel.
- Customer churn: High-effort interactions drive 96% of customer disloyalty (Supportbench, 2023)
How High-Performing Teams Reach 50+ NPS (Operational Playbook)
How can you improve your NPS score in customer support operations?
Improving NPS requires reducing customer journey effort and completely overhauling operational efficiency. You cannot train your way out of a bad system. You must build a better one.
How often should NPS be measured?
Organizations typically use two types of surveys to measure success. Transactional NPS (tNPS) is sent immediately after a support interaction to gauge specific workflow success. Relationship NPS (rNPS) is sent periodically (quarterly or biannually) to measure overall brand sentiment. Using both provides a complete view of operational performance.
High-performing teams follow a strict operational playbook to reach the 50+ threshold:
- Implement a Level 1.5 support layer: This bridges the gap between basic intake and expensive field dispatches. Level 1.5 agents handle complex remote troubleshooting to prevent unnecessary truck rolls. Netfor calls this “Remote Hands”.
- Intelligent intake and routing: Using AI-enabled prioritization to ensure revenue-impacting issues go directly to the right engineer.
- Knowledge management: Providing agents with fast, reliable access to accurate information so they can resolve issues on the first interaction and reduce escalations.
- 48-hour closed-loop feedback: Contacting any detractor within 24 to 48 hours to resolve their complaint and repair the relationship.
Netfor serves as a prime example of this operational architecture in action. By combining AI-enabled IT help desk operations, customer service, and field services into one unified model, Netfor eliminates traditional friction gaps. They maintain an incredible 90% to 92% FCR rate. Furthermore, they answer 97% percent of inbound calls in under 20 seconds.
Comparison Section: NPS 20 vs NPS 50 in IT Support
What separates average support from high-performing support? Most organizations assume improving NPS is about having better customer interactions. In reality, the difference between a 20 and a 50+ score comes down entirely to how the operation is structured.
NPS 20 (Industry Average)
- First Call Resolution (FCR): Hovers around 65% to 70%.
- Transfers: Multiple transfers required before resolution.
- Customer Effort: High. Customers repeat their issue multiple times.
- Support Model: Highly reactive to incoming complaints.
- Escalation Rates: High (15% to 25% or more).
- Prioritization: Limited visibility into critical or revenue-impacting issues.
- Systems: Disconnected help desk and field service platforms.
Outcome: Customers get their issue resolved eventually, but the experience feels slow, fragmented, and frustrating.
NPS 50+ (High-Performing IT Support)
- First Call Resolution (FCR): Consistently hits 80% or higher.
- Transfers: Minimal handoffs due to correct routing from the start.
- Customer Effort: Low. Full context is captured at the initial intake.
- Support Model: Proactive and highly prioritized.
- Escalation Rates: Lower than 15%.
- Prioritization: Revenue-impacting issues are flagged and handled first.
- Systems: Unified help desk and field service operations sharing one database.
Outcome: Customers get fast and accurate resolution with minimal friction, leading to long-term loyalty and brand advocacy.
What Actually Improves NPS
When trying to improve scores, leadership teams generally fall into two categories. They either take a traditional approach or an operational approach.
Traditional Approach (What Most Teams Do)
- Focus heavily on agent training and soft skills.
- Measure the score long after the interaction is over.
- Add more staff to handle rising ticket volumes.
- Treat the metric merely as a reporting number for board meetings.
When it works: This works in low-volume environments with very simple support structures.
Limitation: It does absolutely nothing to fix underlying operational inefficiencies.
Operational Approach (What High Performers Do)
- Improve intake, routing, and triage systems first.
- Optimize the entire workflow for First Call Resolution (FCR).
- Actively reduce customer effort across the entire journey.
- Use automation to scale the business without adding friction.
- Integrate help desk, Customer Experience (CX) management, and field services into one hub.
When it works: This is mandatory for multi-location environments, high-volume support operations, and revenue-sensitive industries like retail, quick-service restaurants, and healthcare.
Key Takeaway: You do not improve NPS by asking better questions on a survey. You improve it by fixing how work flows through your internal systems.
Achieving True Operational Excellence
Your Net Promoter Score is a lagging indicator of your operational quality. Stagnating at an average score of 20 means your internal processes are passing friction onto your users. Reaching a benchmark of 50 or above signifies real operational excellence.
Improving these metrics requires comprehensive system-level changes, not just extra coaching for your frontline agents. The biggest differentiator in the modern IT landscape is integration. Organizations that successfully integrate their IT help desk, Customer Experience Management, and field services consistently outperform those using fragmented models.
When you prioritize intelligent call routing, seamless case intake, and scalable support solutions, you remove the barriers that frustrate users. If your internal teams are struggling to break past the industry average, it is time to evaluate your foundational service desk operations. By partnering with experts in call center management and enterprise IT support, you can rebuild your workflows to deliver fast, effortless, and highly rated customer experiences.
Want to see what a 50+ NPS support model actually looks like in your environment? Let’s walk through it together.